
· By Sajeevan (Saj) Veeriah
Electronics / embedded systems / instrumentation · 10 min read
Inside the Gendio control board: power, protocols and radar positioning
A detailed design study of the ESP32-S3 controller, its power and protocol boundaries, and a radar-based positioning extension that preserves the existing PCB.
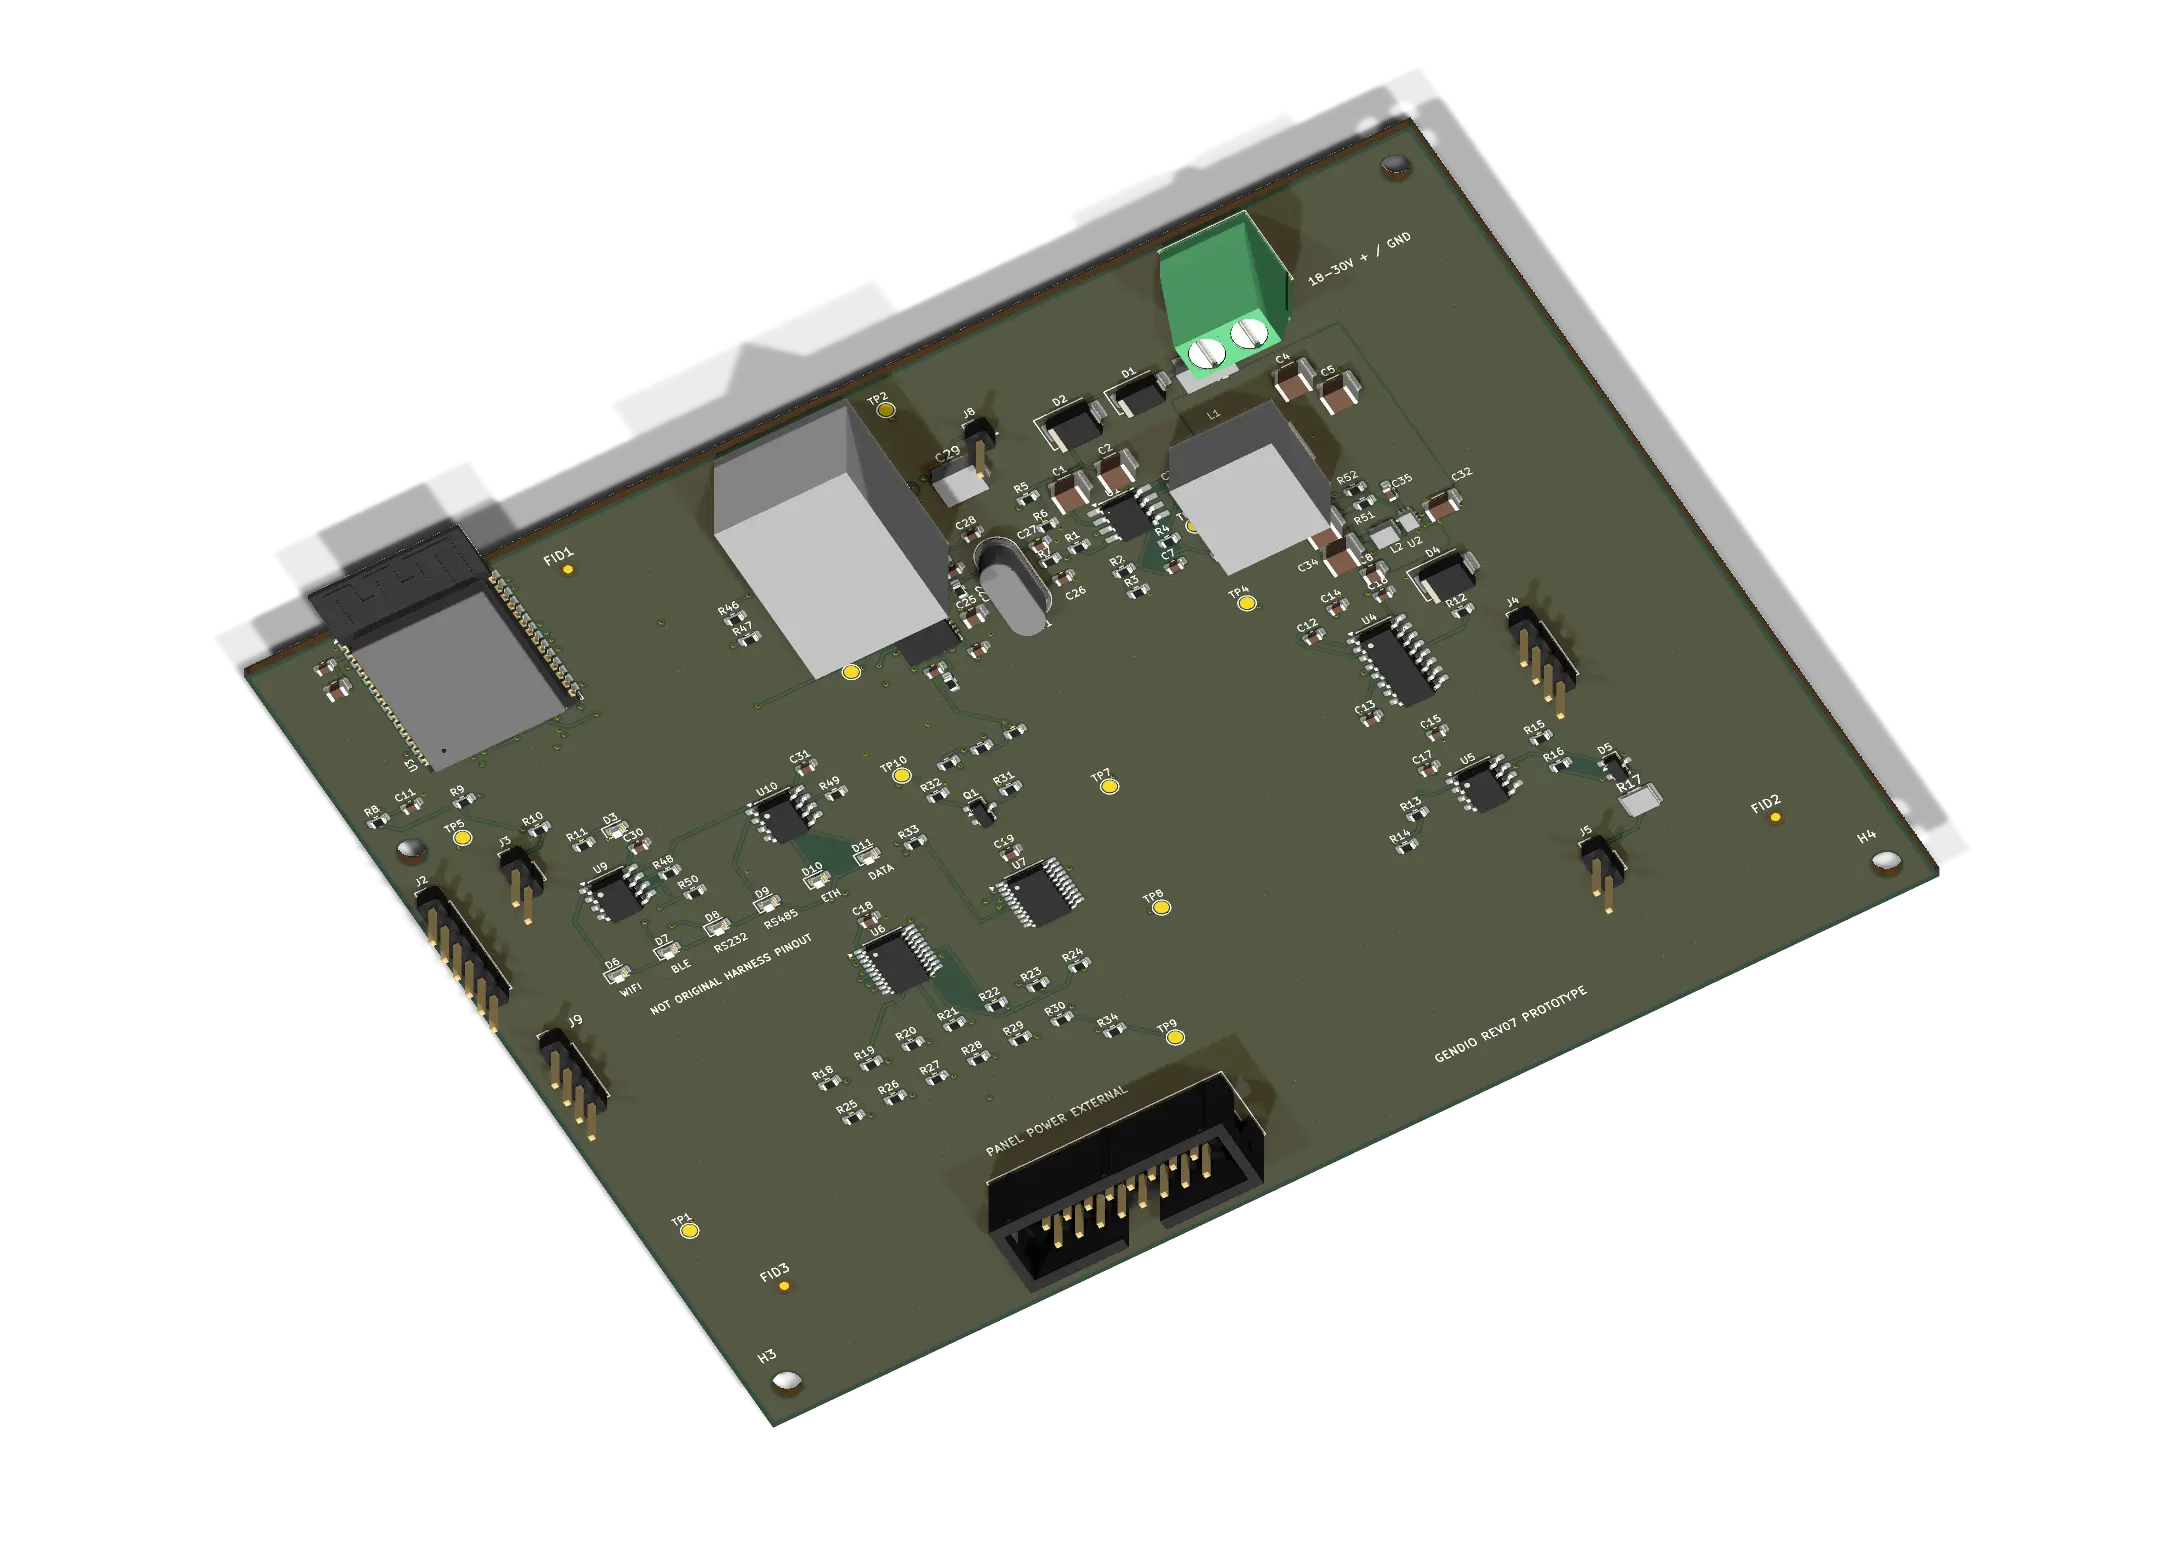
The difficult part of a weighbridge scoreboard is deciding what a displayed value is allowed to mean. A serial port can receive bytes while the weight is invalid. A network link can remain active while its data is stale. A vehicle can produce a steady distance reading without being correctly positioned on the deck.
My Gendio design treats these as separate engineering questions. The controller receives and checks an existing indicator's weight messages, then drives a selected display. The V2 extension adds a measured-position advisory through industrial radar and a gateway, without changing the controller PCB. This article follows the design from power conversion and CAD to packet freshness and experimental acceptance.
The evidence is a manufacturing-oriented board package and a later development release for vehicle positioning. It includes native designs, compiled firmware and recorded software checks. Physical board operation, vehicle trials and environmental qualification remain unverified.
1. Define the claim before choosing the circuit
The weighing indicator remains the measurement instrument. Gendio does not excite load cells or independently measure mass. It interprets an indicator's message, tracks its validity and presents the result. This boundary avoids confusing a display-controller project with a certified weighing system.
The base design accepts one selected input: RS232, RS485, Wi-Fi TCP, Wi-Fi UDP or Ethernet UDP. Bluetooth LE is a service interface. The matrix connector carries logic and ground; the display needs its own power supply. A separate serial adapter supports a remote serial display. Each path has a distinct interface and acceptance test.
| Design item | Engineering interpretation |
|---|---|
| Board supply | 24 V DC nominal, with an 18-30 V design input range. Cabinet and supply qualification are still required. |
| Compute | ESP32-S3-WROOM-1-N8R8; 8 MB flash and 8 MB octal PSRAM in the documented build target. |
| Display | Candidate 128 × 32 matrix with 1/16 scan; actual panel pinout and timing require commissioning. |
| V2 position | Driver/operator information only; no brake, barrier or traffic-light control. |
2. Power capacity belongs to the whole conversion chain
The board uses an LM5164 to generate 5 V, followed by a TPS62902 for a nominal 3.35 V shared logic rail. The schematic retains the +3V3 net name, so reviewers must read the numerical contract as well as the label. The downstream converter's 2 A capability does not increase the upstream converter's 1 A output capacity.
The documented allocation is 0.812 A on the shared rail and 0.138 A directly at 5 V. A conservative corner uses 3.41424 V at the shared rail, 4.85 V into the second converter and 80% assumed conversion efficiency. The resulting upstream current is I5 = (3.41424 × 0.812)/(4.85 × 0.80) + 0.138 = 0.8525 A. Including the documented startup charging allowance raises the screen to about 0.9234 A.
These numbers are allocations, not oscilloscope or current-probe measurements. They expose the narrow margin that must be investigated under radio bursts, Ethernet activity, adapter loading and startup. A part's headline rating cannot replace a simultaneous-load test.
The rail corner screen is 3.2864-3.4142 V before dynamics. Adding the allocated ±150 mV transient, ripple and distribution envelope gives 3.1364-3.5642 V. That allowance is a requirement on the physical implementation, not a demonstrated waveform.
3. Use a model to identify the measurement that matters
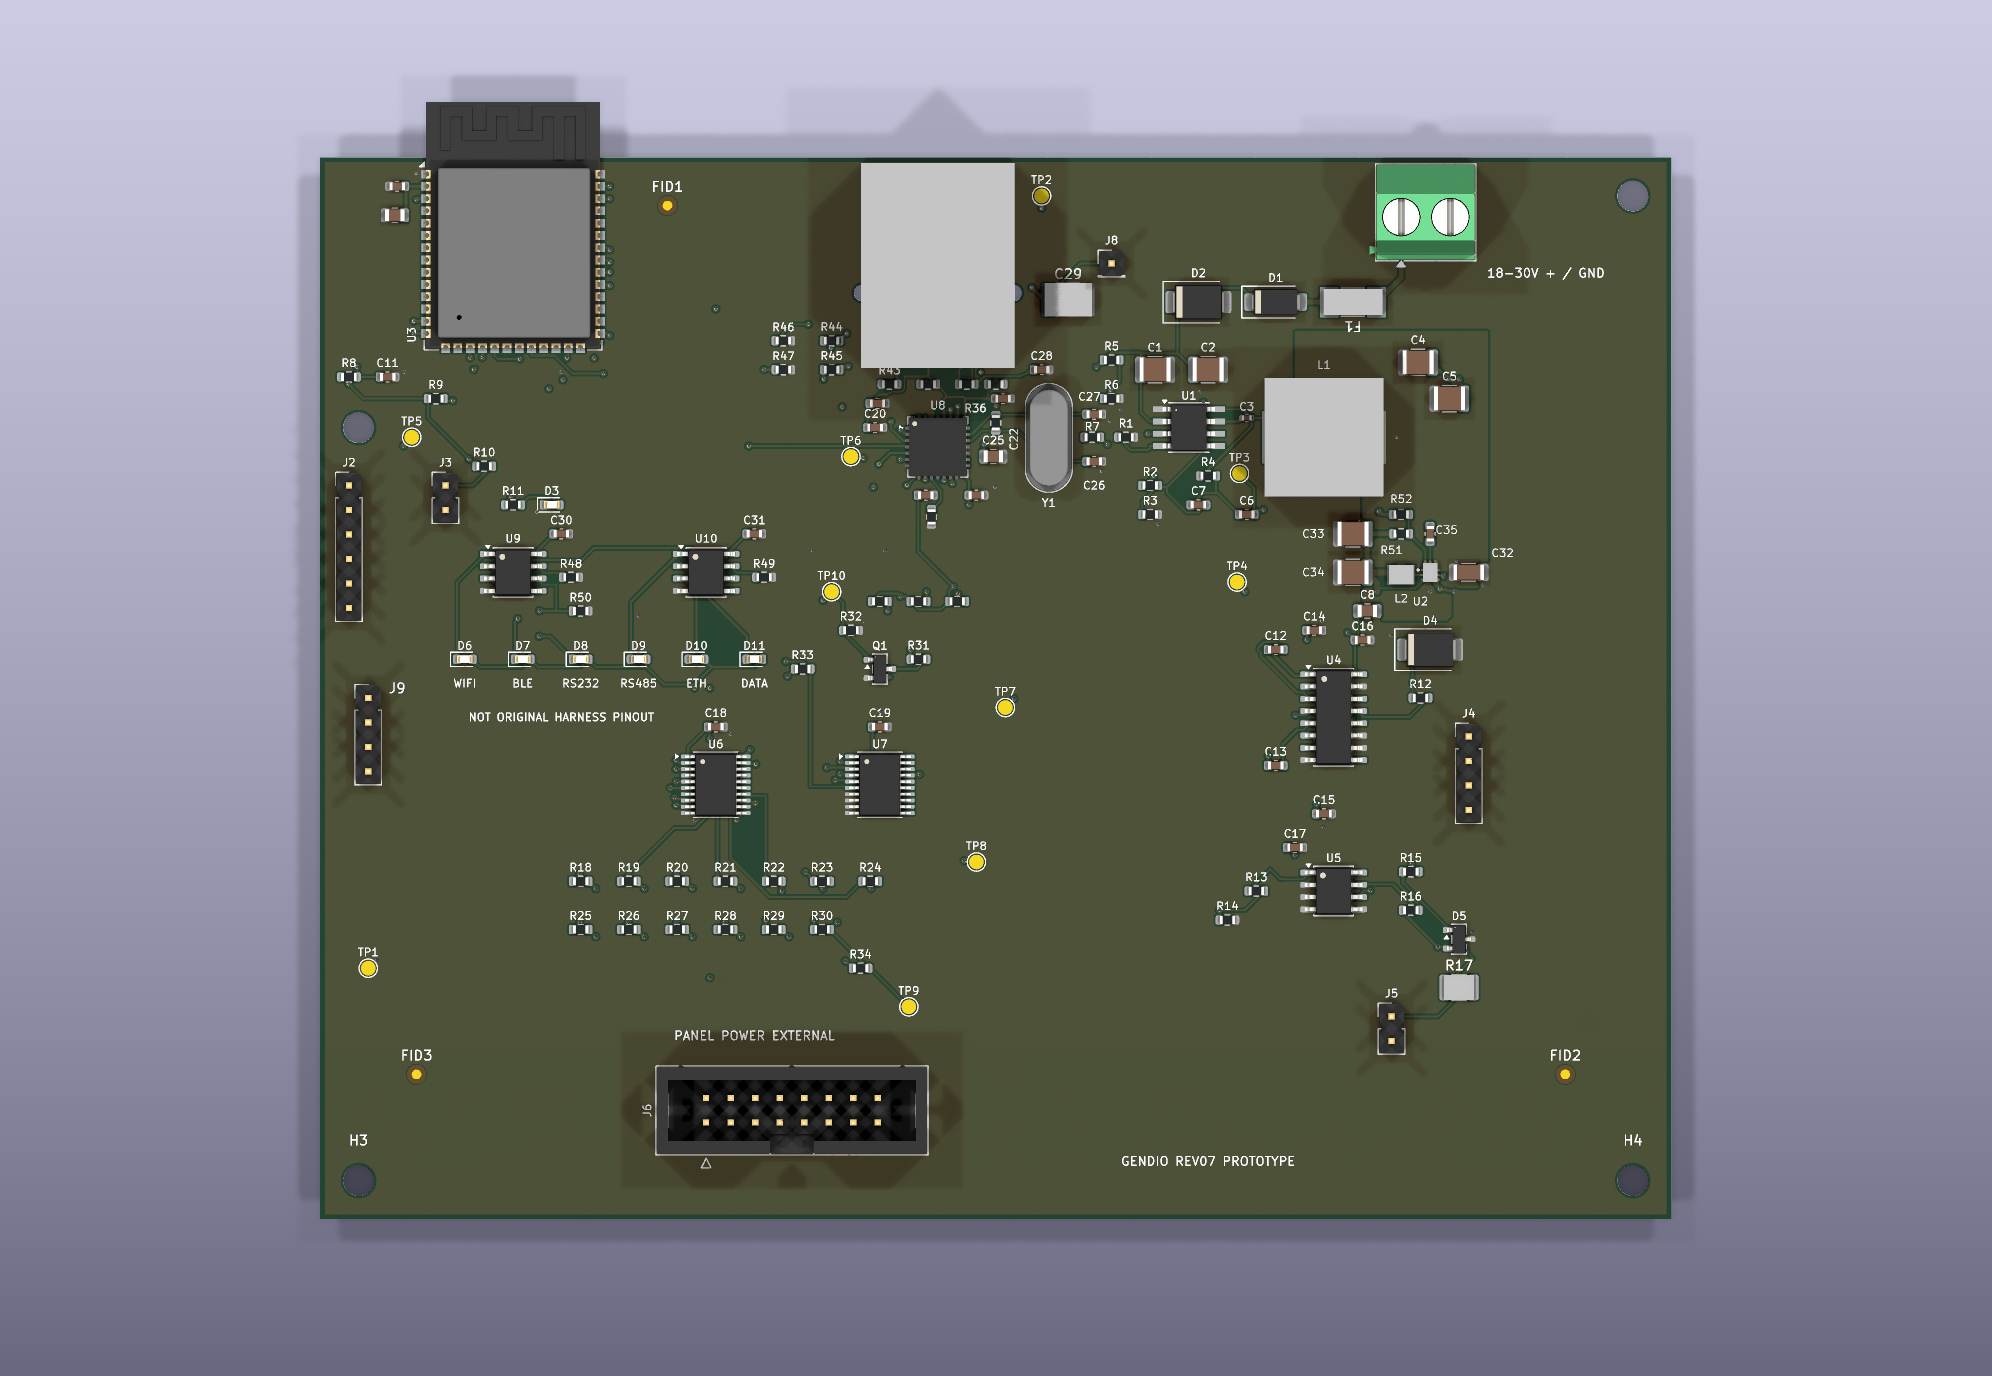
For a load step whose converter current recovers linearly, a first-order charge-deficit estimate is ΔV = ΔI × tr/(2Ceff) + ΔI × ESR. Here ΔI is the additional load current, tr the assumed recovery interval and Ceff the capacitance after the chosen bias and tolerance reductions.
For example, ΔI = 0.5 A, tr = 10 µs, Ceff = 30.294 µF and ESR = 10 mΩ produce about 87.5 mV of predicted droop. Doubling the recovery interval increases it to about 170.1 mV, beyond the 150 mV allocation. This is an illustrative recalculation of the package's sensitivity model, not a simulation of the TPS62902 control loop.
The package contains LM5164-related LTspice studies, but the encrypted TPS62902 vendor model was not executed there. Treating every spreadsheet or transient study as a validated converter model would hide that difference.
Thermal screening is equally conditional. At approximately 0.693 W estimated loss, a 60 °C ambient and a 125 °C junction target require a thermal resistance below roughly 94 K/W. Board copper, enclosure conditions and airflow determine whether the assembled product meets that requirement. The correct next step is a measured worst-case thermal test, including the inductor and connector temperatures.
4. CAD joins electrical intent to assembly
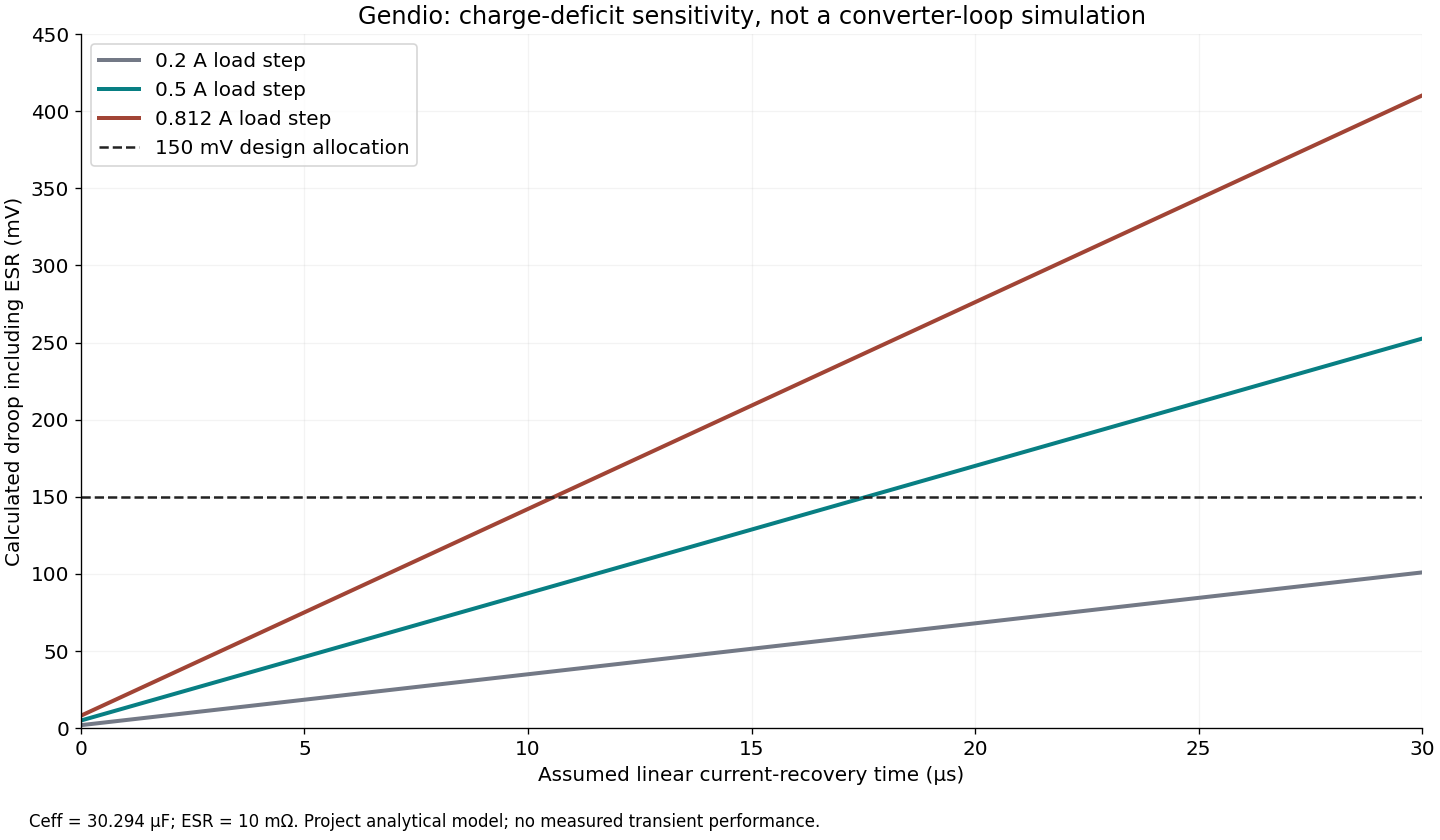
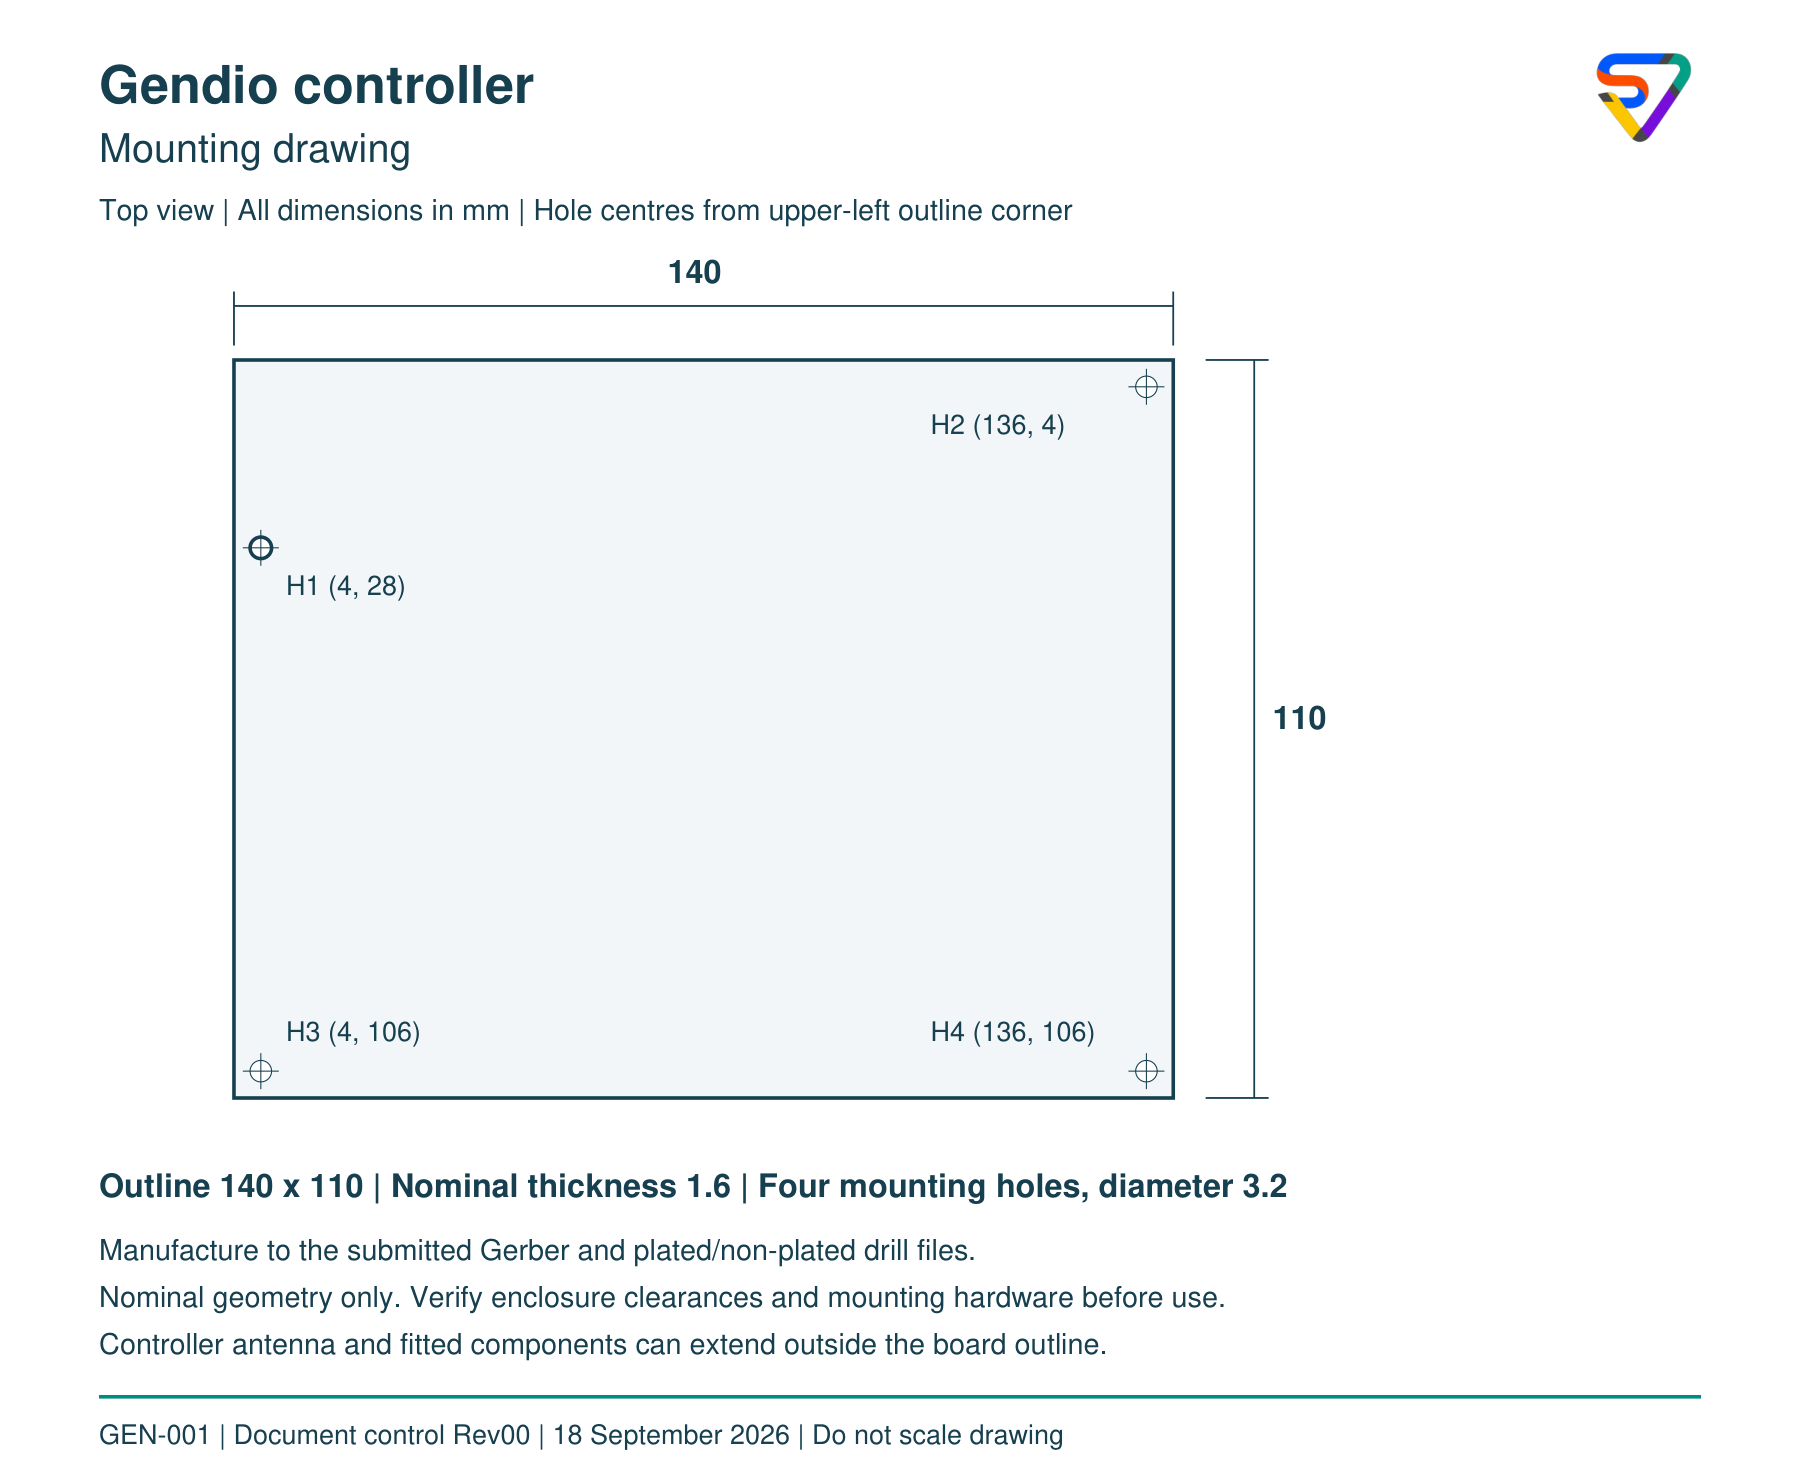
The native KiCad projects are the board fabrication authority. Mechanical STEP assemblies, mounting drawings and nominal component bodies support enclosure review and access planning. Converted EasyEDA projects need comparison with that authority before another manufacturing release.
I use the mechanical view to ask practical questions: can the programming header be reached, does the panel ribbon clear adjacent parts, can the Ethernet lead bend without loading the socket, and will cabinet metal obstruct the module antenna? A successful STEP export answers none of those questions by itself.
The controller and serial adapter remain separate assemblies. Their short internal harness has its own pin and load contract. That modularity makes the output interface explicit and keeps a field-system BOM distinct from a board assembly BOM.
5. A byte received is not a value accepted
The firmware separates input acquisition, protocol parsing, receiver state, display formatting and matrix scanning. Configuration and update handling have their own inhibition rules. Restart begins with outputs disabled; changes to relevant settings disarm outputs.
The package records 31 parser profiles. That means 31 implemented formats exercised with synthetic fixtures, not certification for every product sold by the manufacturers named in the registry. Commissioning needs captured frames from the actual indicator, including sign, decimal position, unit, status and malformed traffic.
The diagnostic lamps deliberately expose different observations. A serial lamp reports recent bytes on the selected input; the Ethernet lamp reports PHY link; the data lamp requires a live receiver and no update inhibit. This makes it possible to investigate a connected-but-invalid system without pretending that every green indication means the same thing.
The local management interface uses authentication and guarded writes, while the documented implementation has neither HTTPS nor signed-release enforcement. It belongs on an access-controlled equipment network. A checksum validates accidental corruption; it does not establish who sent the data.
6. Extend the system without silently changing the PCB
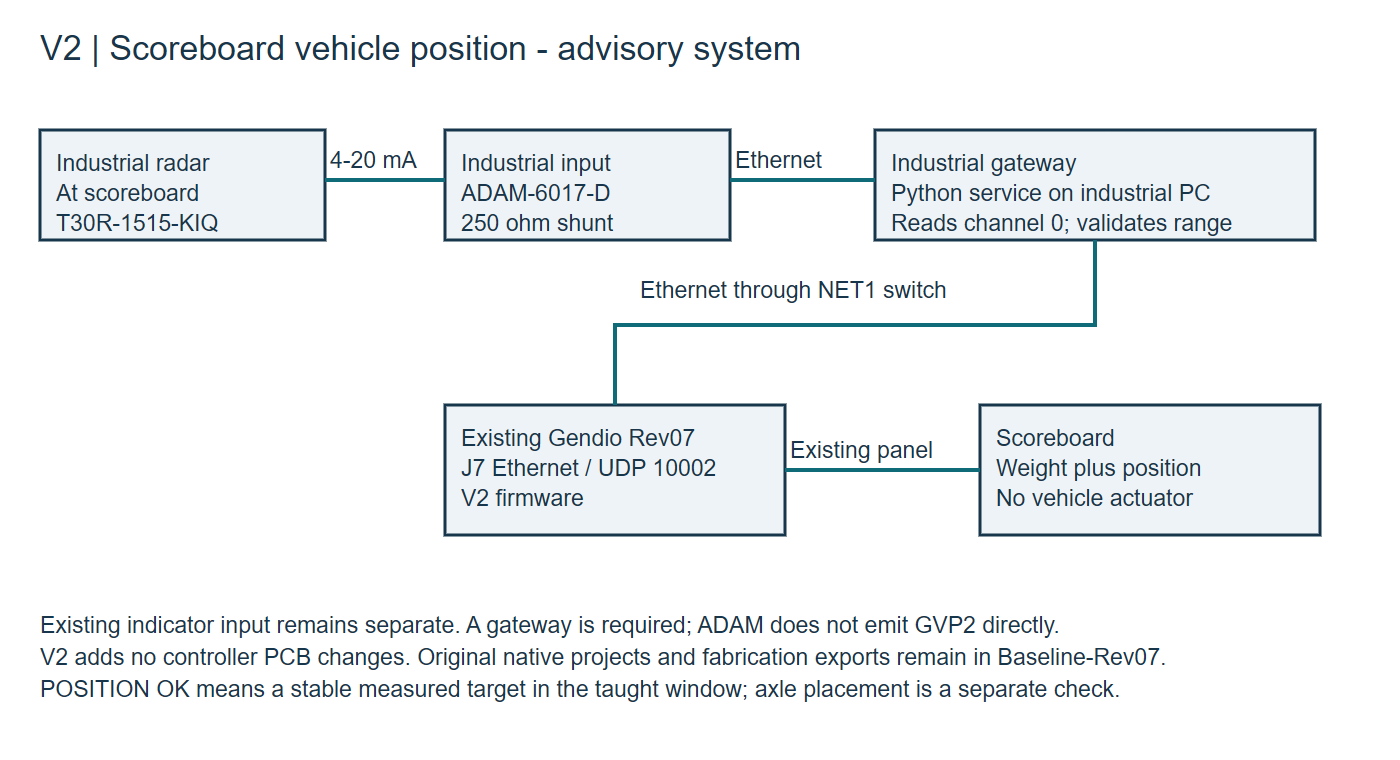
The V2 candidate chain is Banner T30R-1515-KIQ radar, a 250 Ω shunt, an Advantech ADAM-6017-D input, a Python gateway and the existing controller Ethernet interface. The gateway is necessary: the controller's bounded IPv4/UDP implementation does not become a general Modbus/TCP or REST client merely because an industrial I/O module is connected.
The radar's 4-20 mA output is configured over a project span of 1-10 m. Across 250 Ω it becomes 1-5 V; the input module is set to 0-10 V so low-signal and overrange conditions remain observable. The gateway rejects an invalid range or read, rather than turning a fault into a plausible stopping distance.
The architecture below leaves the weighing input separate. V2 adds a position line to the candidate matrix and a dashboard card. Existing serial Ranger output remains weight-only. A serial-only installation therefore needs a separately supported advisory display.
7. Resolution, accuracy and target selection are different
For the configured span, dmm = 1000 + (ImA - 4) × 9000/16. At 3000 mm, the expected signal is 7.5556 mA, or 1.8889 V across the shunt. With the package's 16-bit 0-10 V mapping, one count represents about 0.3433 mm. This is conversion granularity, not end-to-end distance accuracy.
A measurement budget must include radar behaviour, target geometry, alignment, input-module error, shunt tolerance and temperature. At the 3 m example, a 0.1% shunt error alone corresponds to approximately 4.25 mm when the nominal conversion is used, before the other contributors. Correlated errors should not be hidden inside a root-sum-square calculation without justification.
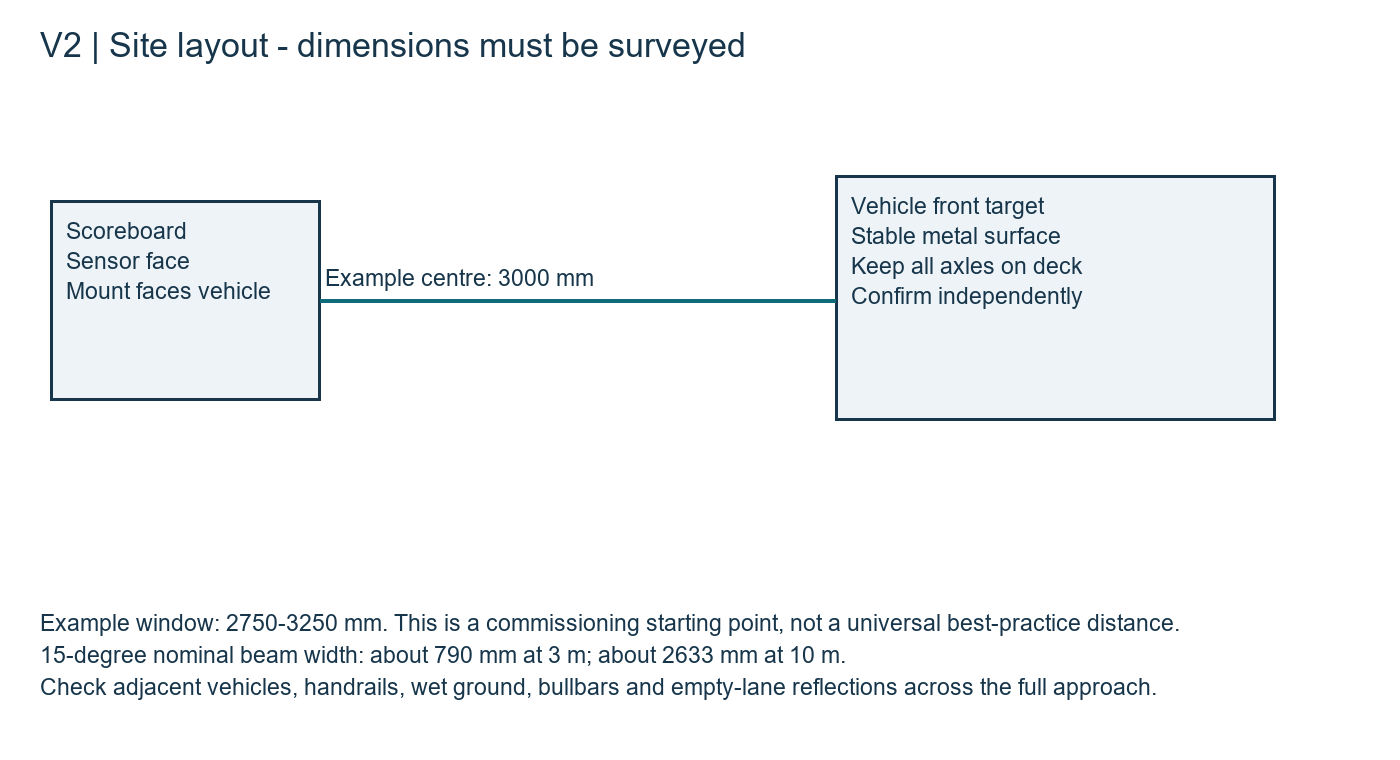
A geometric screen for a nominal 15° beam is W = 2d tan(7.5°): about 0.79 m at 3 m and 2.63 m at 10 m. The sensor can encounter rails, bullbars or another vehicle within a broad region. The beam sketch is not a hard detection boundary. Target trials must precede a fixed teaching distance.
The package uses a 3000 mm centre and ±250 mm window as commissioning examples. They are not a universal stop location. The bracket drawing likewise represents a mounting concept, with its height and orientation still dependent on the fleet and site survey.
Sources: [3]
8. A fresh packet can still contain an old physical observation
The GVP2 payload is 20 bytes: a four-byte identifier followed by 32-bit sequence, distance, validity and CRC fields. The receiver checks the network envelope and rejects repeated or backwards sequences. A 750 ms receive timeout withdraws the position indication; recovery requires a new settling period.
That timer is only one part of the observation chain. Banner documents a two-second delay before its configured analogue loss-of-signal output changes. The project's conservative budget adds 450 ms for a gateway cycle, 750 ms for packet timeout and 50 ms for rendering, giving 3.25 s. These terms need not all occur together, and the budget has not been measured on installed hardware.
A gateway can keep sending new sequence numbers for a frozen but plausible analogue value. The freshness mechanism cannot establish that the physical target changed or that the sensor is healthy. This is an observability limit of the single-channel design.
POSITION OK requires readings inside the taught window with no more than 40 mm total excursion over 3 s. A monotonic creep of about 13.3 mm/s can satisfy that initial interval. The state therefore means a stable measured target within the chosen criterion, not zero velocity, correct axle placement or permission to move.
Sources: [3]
9. Verification needs a claim-by-claim structure
The supplied September records report successful firmware compilation, host protocol/state tests, gateway tests and mocked dashboard checks. I am reporting those recorded runs; publishing this article does not rerun the embedded toolchain or turn mocked responses into equipment measurements.
| Design item | Engineering interpretation |
|---|---|
| Recorded software evidence | V2 compilation plus synthetic packet/state tests and six gateway tests, including loopback HTTP and redirect rejection. |
| Recorded board evidence | Native board checks and manufacturing exports belong to the retained baseline. V2 introduces no new PCB geometry. |
| Physical evidence | No assembled-board, radar/ADAM integration or vehicle acceptance results are supplied. |
| Publication review | CAD figures, source references and worked calculations were reviewed for this article; that review is not hardware qualification. |
A defensible experiment would log reference distance, raw voltage, gateway value, packet arrival and displayed state against one timebase. Test stationary and moving targets separately, then inject power loss, network loss, wrong range settings, duplicate packets and an in-range frozen signal. Measure withdrawal latency from the physical event, not just the last packet.
The proposed site trial starts with representative vehicle classes and at least 30 approaches per class. Include difficult frontal geometry, empty-lane clutter, wrong stopping positions and slow creep. This is a coverage plan, not a statistical reliability claim; zero observed failures in a small trial cannot establish a safety integrity level.
10. Keep the design space open
When an engineering project is not locked too early into a fixed budget, inherited geometry or assumed design constraints, the possibilities for innovation can feel vast and endless. That freedom is most useful at the exploration stage: it lets me ask whether the architecture itself should change, instead of merely optimising the first answer.
The eventual product still needs limits that can be defended. Physics, safety and evidence do not disappear when a budget expands. I want to keep the imagination open while making each claim precise enough to test.
“Stay Hungry; Stay Foolish” - Steve Jobs. Jobs used the words “Stay hungry. Stay foolish.” in his 2005 Stanford address, recalling the farewell message of the Whole Earth Catalog.
Sources: [5]
Sources and further reading
Project evidence: 20260918-Gendio-Control-Board-Rev00 and 20260920-Gendio-Scoreboard-Position-V2-Rev00, including engineering references, design contracts and verification records. Primary vendor pages checked 20 September 2026; the Advantech reference was inspected from the retained manual. This is an engineering design study, not a peer-reviewed paper or a field-performance report. CAD downloads are review models, not a complete fabrication release.
- Texas Instruments: LM5164 product documentation; Rev. D datasheet listed 19 February 2026
- Texas Instruments: TPS62902 converter documentation
- Banner T30R manual, 217048 Rev. H, 4 June 2025; analogue loss-of-signal behaviour
- Advantech ADAM-6000 manual, Edition 12, November 2022; retained copy reviewed in the project package
- Stanford: Steve Jobs commencement address, 12 June 2005