
· By Sajeevan (Saj) Veeriah
Applied machine learning · 4 min read
99% accuracy can still miss every defect
A worked inspection example showing why defect recall, false rejects and review workload belong beside the headline accuracy score.
Suppose an inspection batch contains 10000 parts, of which 100 are defective. A system that passes every part reports 99% accuracy. It also misses every defect.
That is a useful arithmetic check before anyone celebrates a model score. The operational question is which mistakes the system makes, how often it makes them, and what happens to the affected parts.
Keep the four counts visible
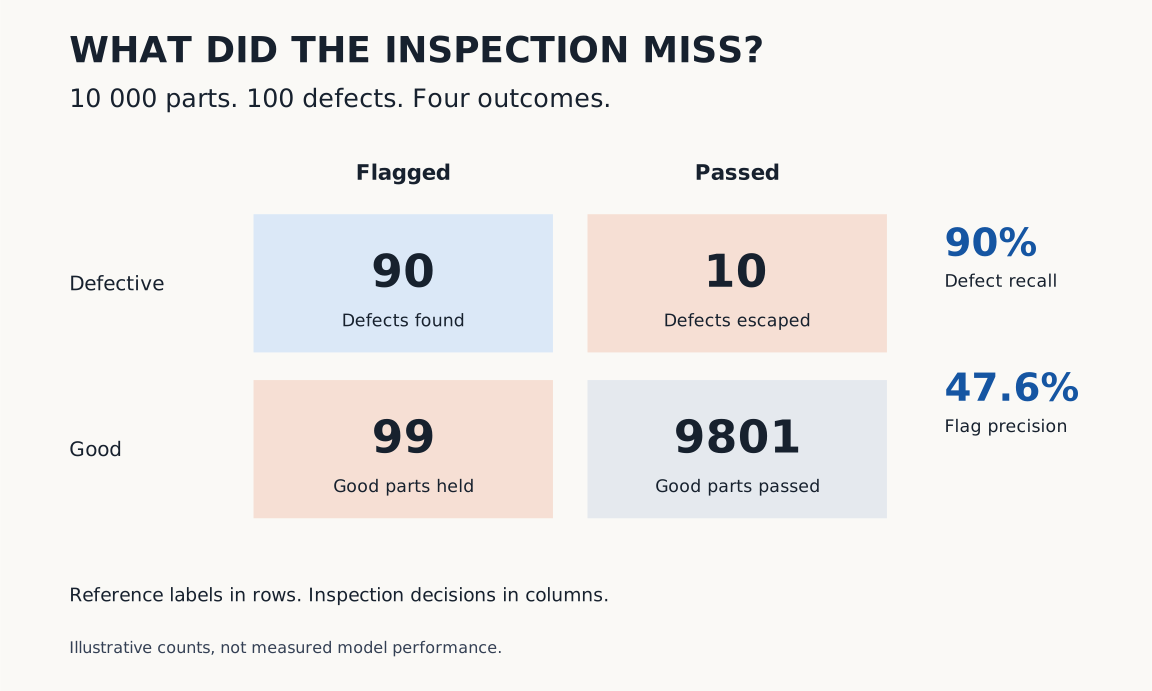
Now imagine a second classifier on the same batch. It flags 90 of the 100 defective parts and incorrectly flags 99 of the 9900 good parts. Ten defects escape, while 9801 good parts pass.
Its overall accuracy is (90 + 9801) / 10000 = 98.91%. That is lower than the pass-everything baseline, despite finding 90 defects. Whether it is useful depends on the actual requirements and the cost of each outcome.
Here, positive means flagged as defective. Recall is the fraction of actual defects flagged: 90 / 100 = 90%. Precision is the fraction of flagged parts that really are defective: 90 / (90 + 99), approximately 47.6%. The confusion matrix keeps the underlying counts available.
| Outcome | Illustrative count |
|---|---|
| Defect flagged: true positive | 90 |
| Defect passed: false negative | 10 |
| Good part flagged: false positive | 99 |
| Good part passed: true negative | 9801 |
Sources: [1]
Translate the score into work
If every flagged part enters manual review, this batch creates 189 reviews. Of those, 99 concern good parts. That workload is invisible in the statement '90% of defects detected'.
For an illustrative review time of 30 seconds per part, 189 reviews require 5670 seconds, or 94.5 minutes. This is direct review time only; it excludes handling, interruptions, rework and any queue. A deployment decision needs measured timings, not this assumed value.
The ten escaped defects also need an explicit owner and consequence. A cosmetic mark and a structural defect cannot share an acceptance rule merely because they both have the label 'defective'. Separate the defect categories that lead to different decisions.
A different defect rate changes the picture
Consider a second hypothetical population with a 0.1% defect rate. In 100000 parts that means 100 defects and 99900 good parts. Assume, only for this calculation, that recall remains 90% and the false-positive rate remains 1%.
The expected counts become 90 flagged defects and 999 flagged good parts. Precision is then 90 / 1089, approximately 8.3%. The same assumed class-specific rates now produce more than eleven good-part reviews for each detected defect.
This is a population calculation, not a prediction that a deployed model will retain those rates. Changes in parts, lighting or defect types can change them too. Report the prevalence and sampling method behind an evaluation so readers know which population the score describes.
Treat the threshold as an operating decision
For a classifier whose larger score means stronger evidence of a defect, lowering the flagging threshold generally increases recall while also flagging more good parts. The appropriate threshold depends on the application, not simply a default value.
Choose and validate it using data separate from model training, and keep a final test set untouched by threshold selection. Scikit-learn's threshold guidance explicitly warns about overfitting when the same data is used to train the classifier and tune the threshold.
For the proposed inspection, compare candidate thresholds using escaped defects by category, false rejects and reviews per batch. A score curve is useful when it helps choose between those concrete outcomes.
Sources: [2]
Write an acceptance statement someone can test
A useful report names the evaluated parts, the reference-labelling method, the defect counts, the selected threshold and the conditions of capture. Include the confusion matrix and failures that were inspected, rather than only the most flattering average.
My proposed acceptance template would state a maximum tolerated escape rate for each relevant defect class, a false-reject limit, and a review capacity. Those limits must come from the process owner and applicable requirements; the numbers in this article are not suggested limits.
Retain uncertain labels and unreadable images as explicit cases. Quietly excluding them can make an evaluation easier than the real inspection. A production system still has to decide where those parts go.
Before release, run an independent batch through the complete decision path and reconcile every part against its reference outcome. The handover should make it possible to answer: which defects escaped, which good parts were held, and could the team handle the resulting work?
Sources and further reading
Sources checked on 16 September 2026. All batches, predictions and review times are illustrative. No model was trained or evaluated for this article. The examples do not establish an acceptable defect escape rate or inspection qualification.